Predicting Drug Sensitivity in Cancer Cell Lines and Tumors with Transcriptomic Machine Learning Models
Research Impact
In a recent article, Bender et al. 2026 showed that having a viable biomarker strategy for drugs can cut developmental costs by almost half (Fig.1b in the paper). This result highlights the importance of biomarker discovery in oncology drug development. Here, I present a simulation study that aims to help translate in vitro drug sensitivity screens into tumor biomarker discovery, and to provide practical guidance on designing cancer cell line panel screens.
I am a US-based independent consultant specializing in NGS, omics, and statistical and ML analysis. Contact me via LinkedIn if you have a project I can help with! https://www.linkedin.com/in/jay-cy-chung/
Results
In my previous post, I aligned gene expression data from CCLE cancer cell lines (Ghandi et al. 2019) and TCGA tumors (Weinstein et al. 2013) using Celligner (Warren et al. 2021) and a domain-adversarial autoencoder (AE; Ganin et al. 2016; He et al. 2022). In this post, I run a simulation to answer a few questions that matter for oncology biomarker discovery. I select six drugs from the DepMap PRISM drug screen (Corsello et al. 2020) and ask whether the aligned transcriptomes can predict drug sensitivity in unseen cell lines and infer drug responses in tumors. Here are the key questions and findings:
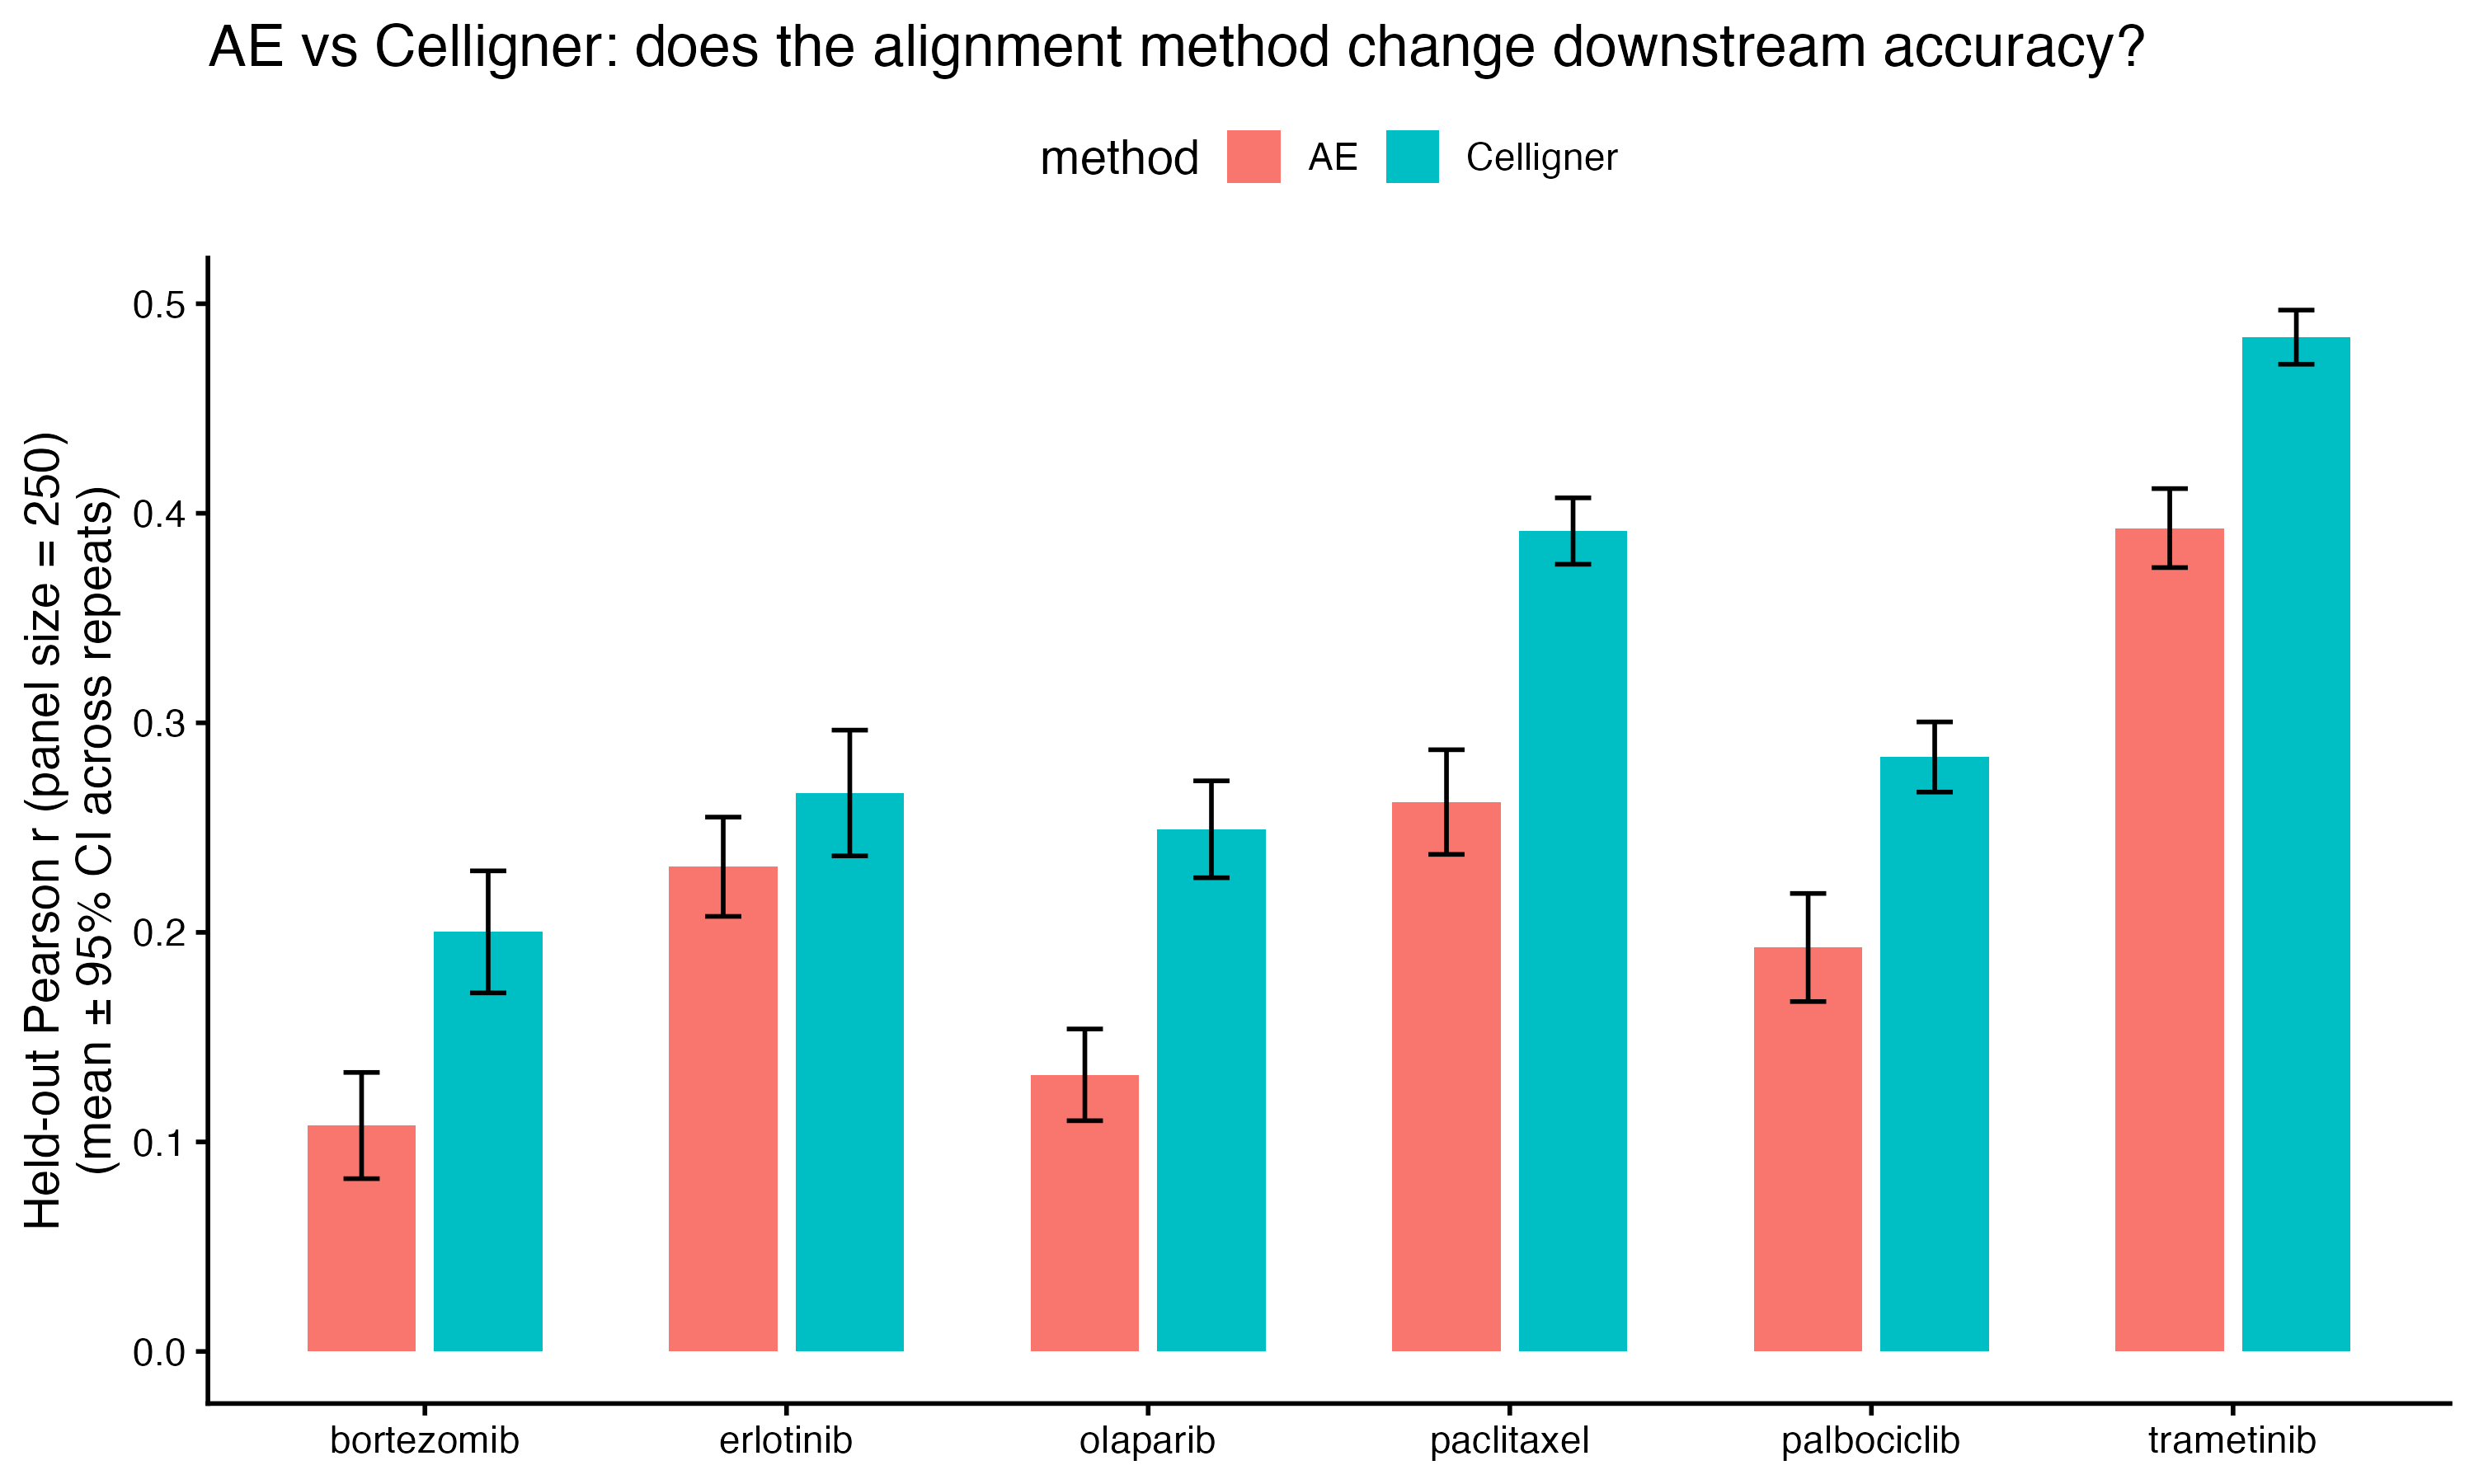
- How does prediction accuracy compare between Celligner- and AE-aligned data? Six drugs with different mechanisms of action and expected predictability are selected. For each drug, I randomly sampled 250 cell lines and predicted drug sensitivity (AUC; lower indicates higher sensitivity) with elastic net (EN) regression (Zou & Hastie 2005). Hyperparameters were tuned so that each model is optimized for its condition (see Additional Notes). Celligner-aligned data outperformed AE-aligned data in predicting drug sensitivity for held-out (unseen) cell lines for most drugs. The AE model compresses expression into a 256-dimensional latent space, which may reduce accuracy. Fine-tuning the AE model or evaluating more drugs could lead to a different conclusion.
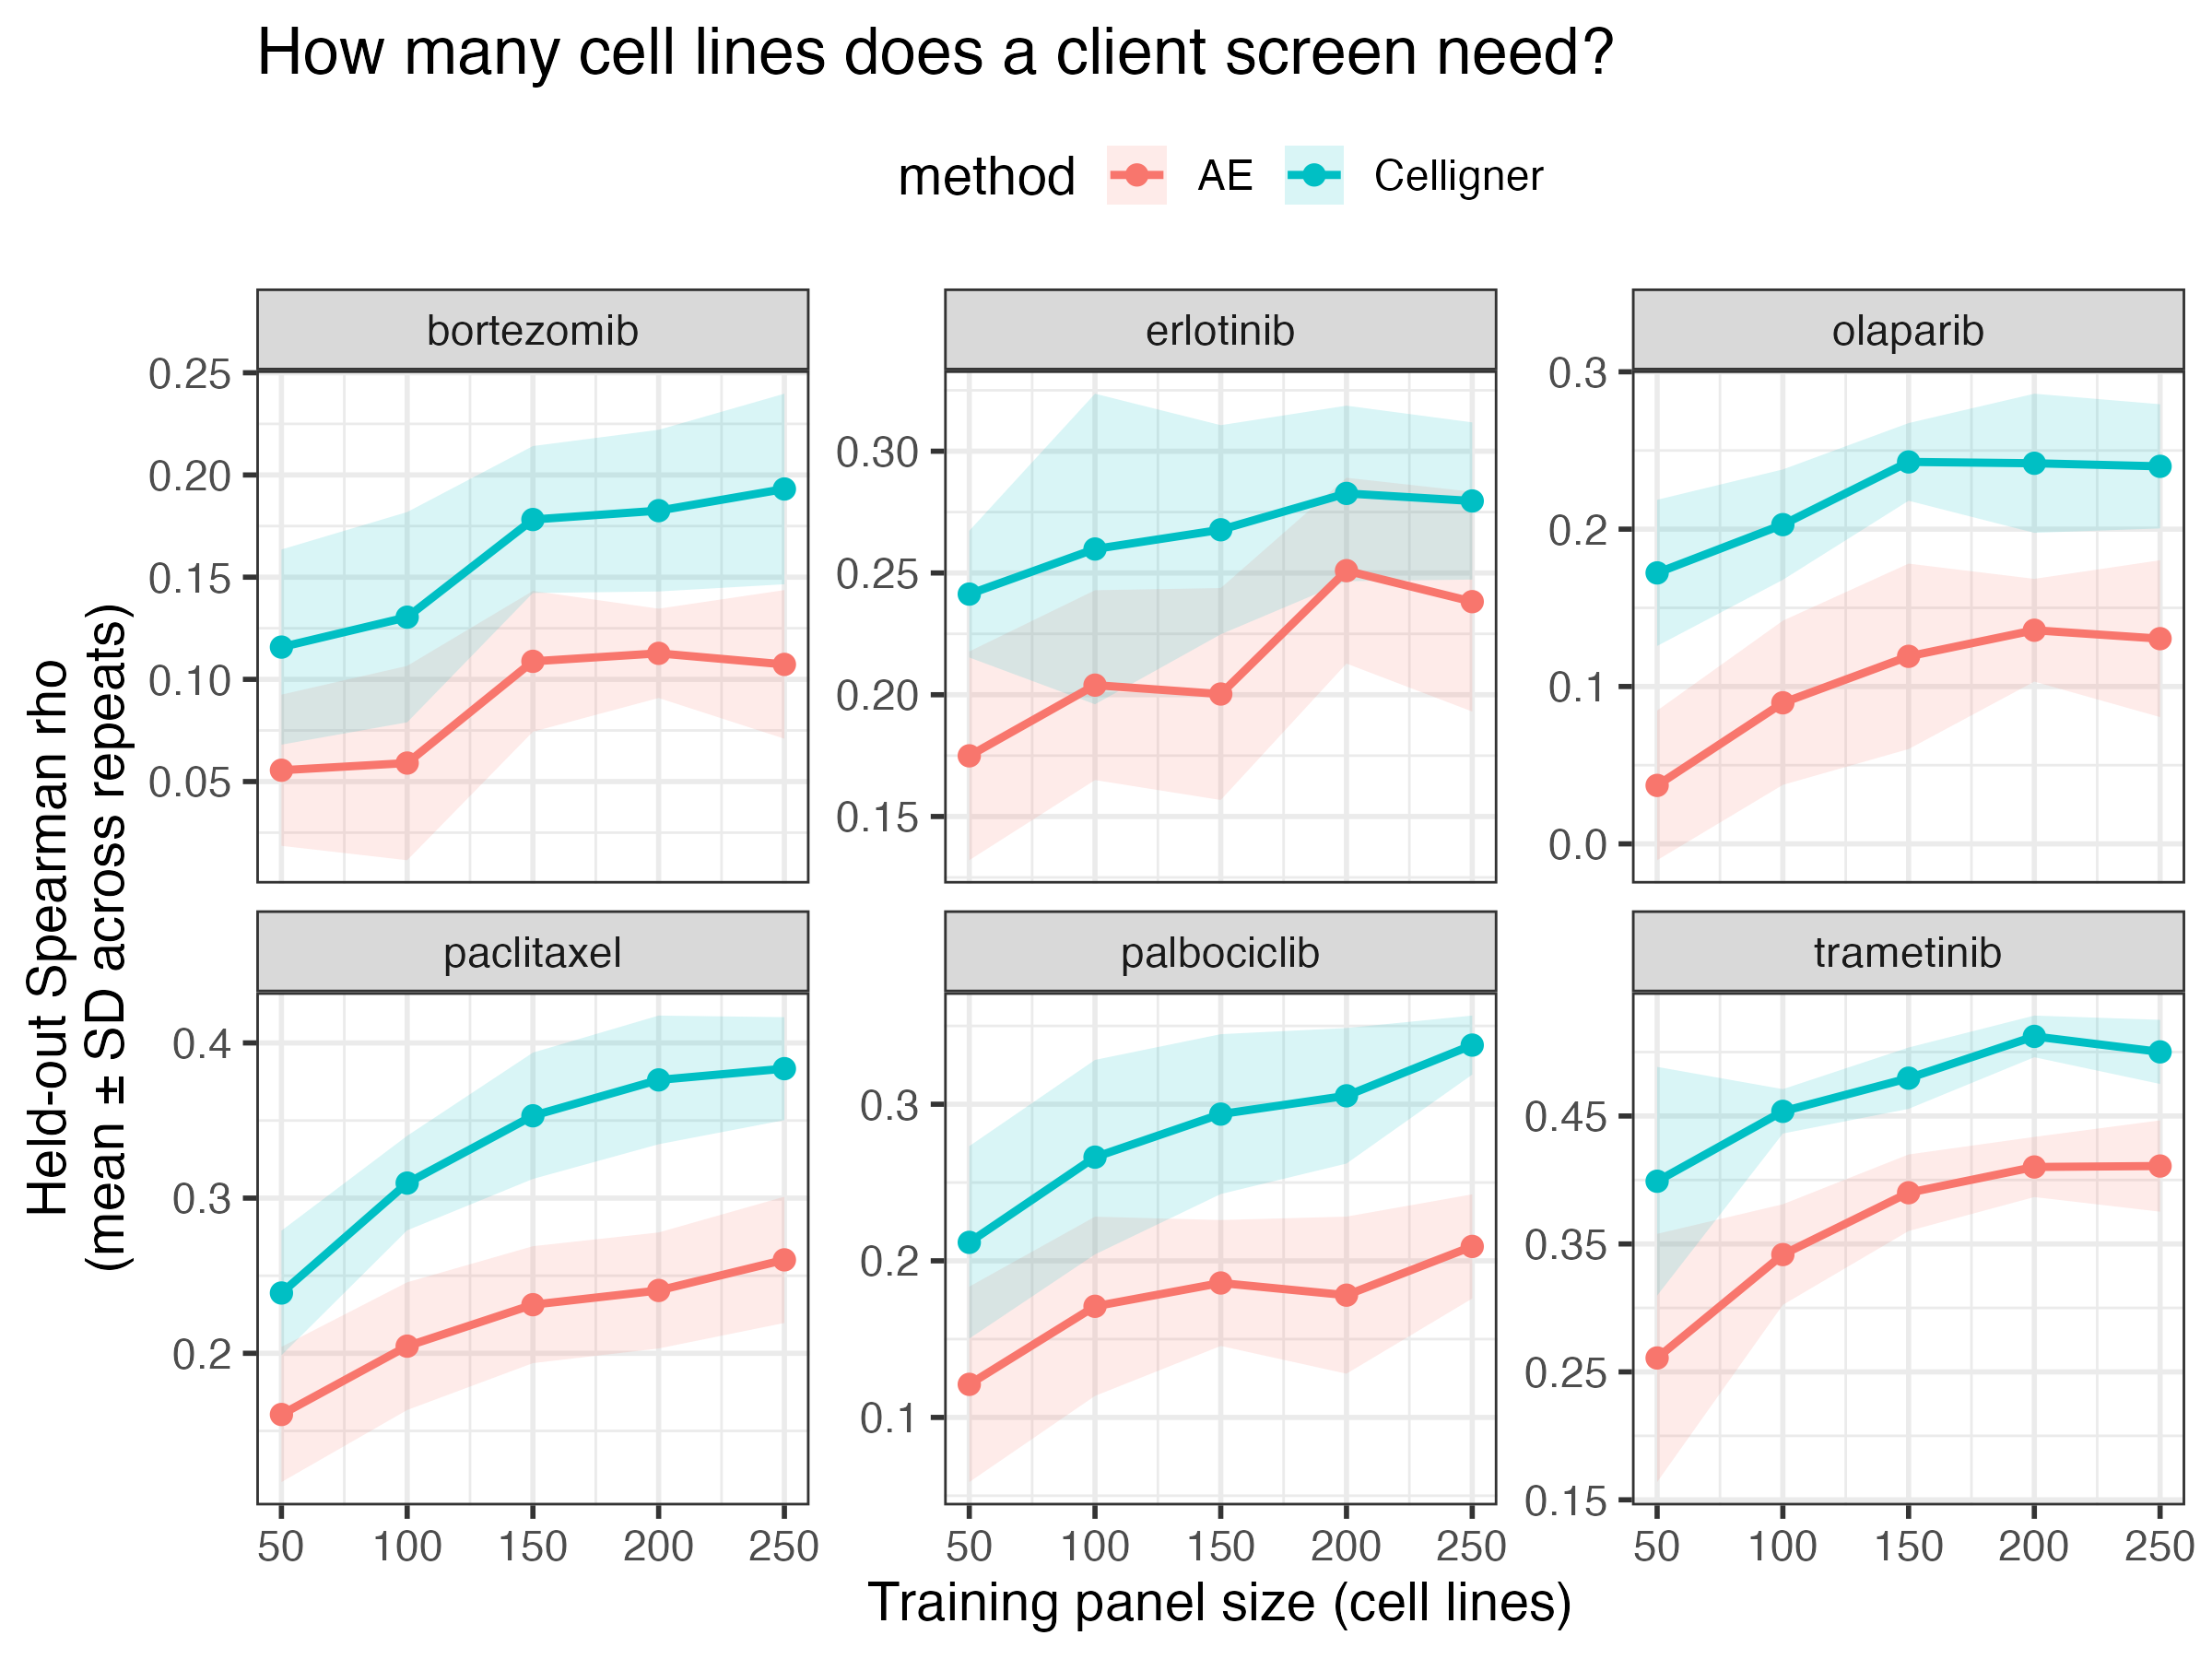
- How many cell lines does an in vitro drug sensitivity screen need for good prediction accuracy? For each drug, panels of 50 to 250 cell lines were randomly sampled 10 times and used to train EN models that predict held-out cell lines. Accuracy rises most steeply from 50 to 150 cell lines and then gradually plateaus. This suggests that a panel of about 150 cell lines may be enough to capture most of the predictable signal, although the exact number likely depends on the drug and its mechanism of action.
- Is it better to concentrate a panel screen in one cancer lineage or spread it across lineages? Using the same random sampling approach, I built panels of 30 cell lines drawn either from a single lineage or from multiple lineages, and evaluated both on the same held-out cell lines spanning all lineages. For most drugs, the lineage-spread panel performed better than the lineage-concentrated panel, suggesting that a diverse panel is more informative. Drugs with lineage-specific mechanisms of action may still benefit from a lineage-concentrated screen.

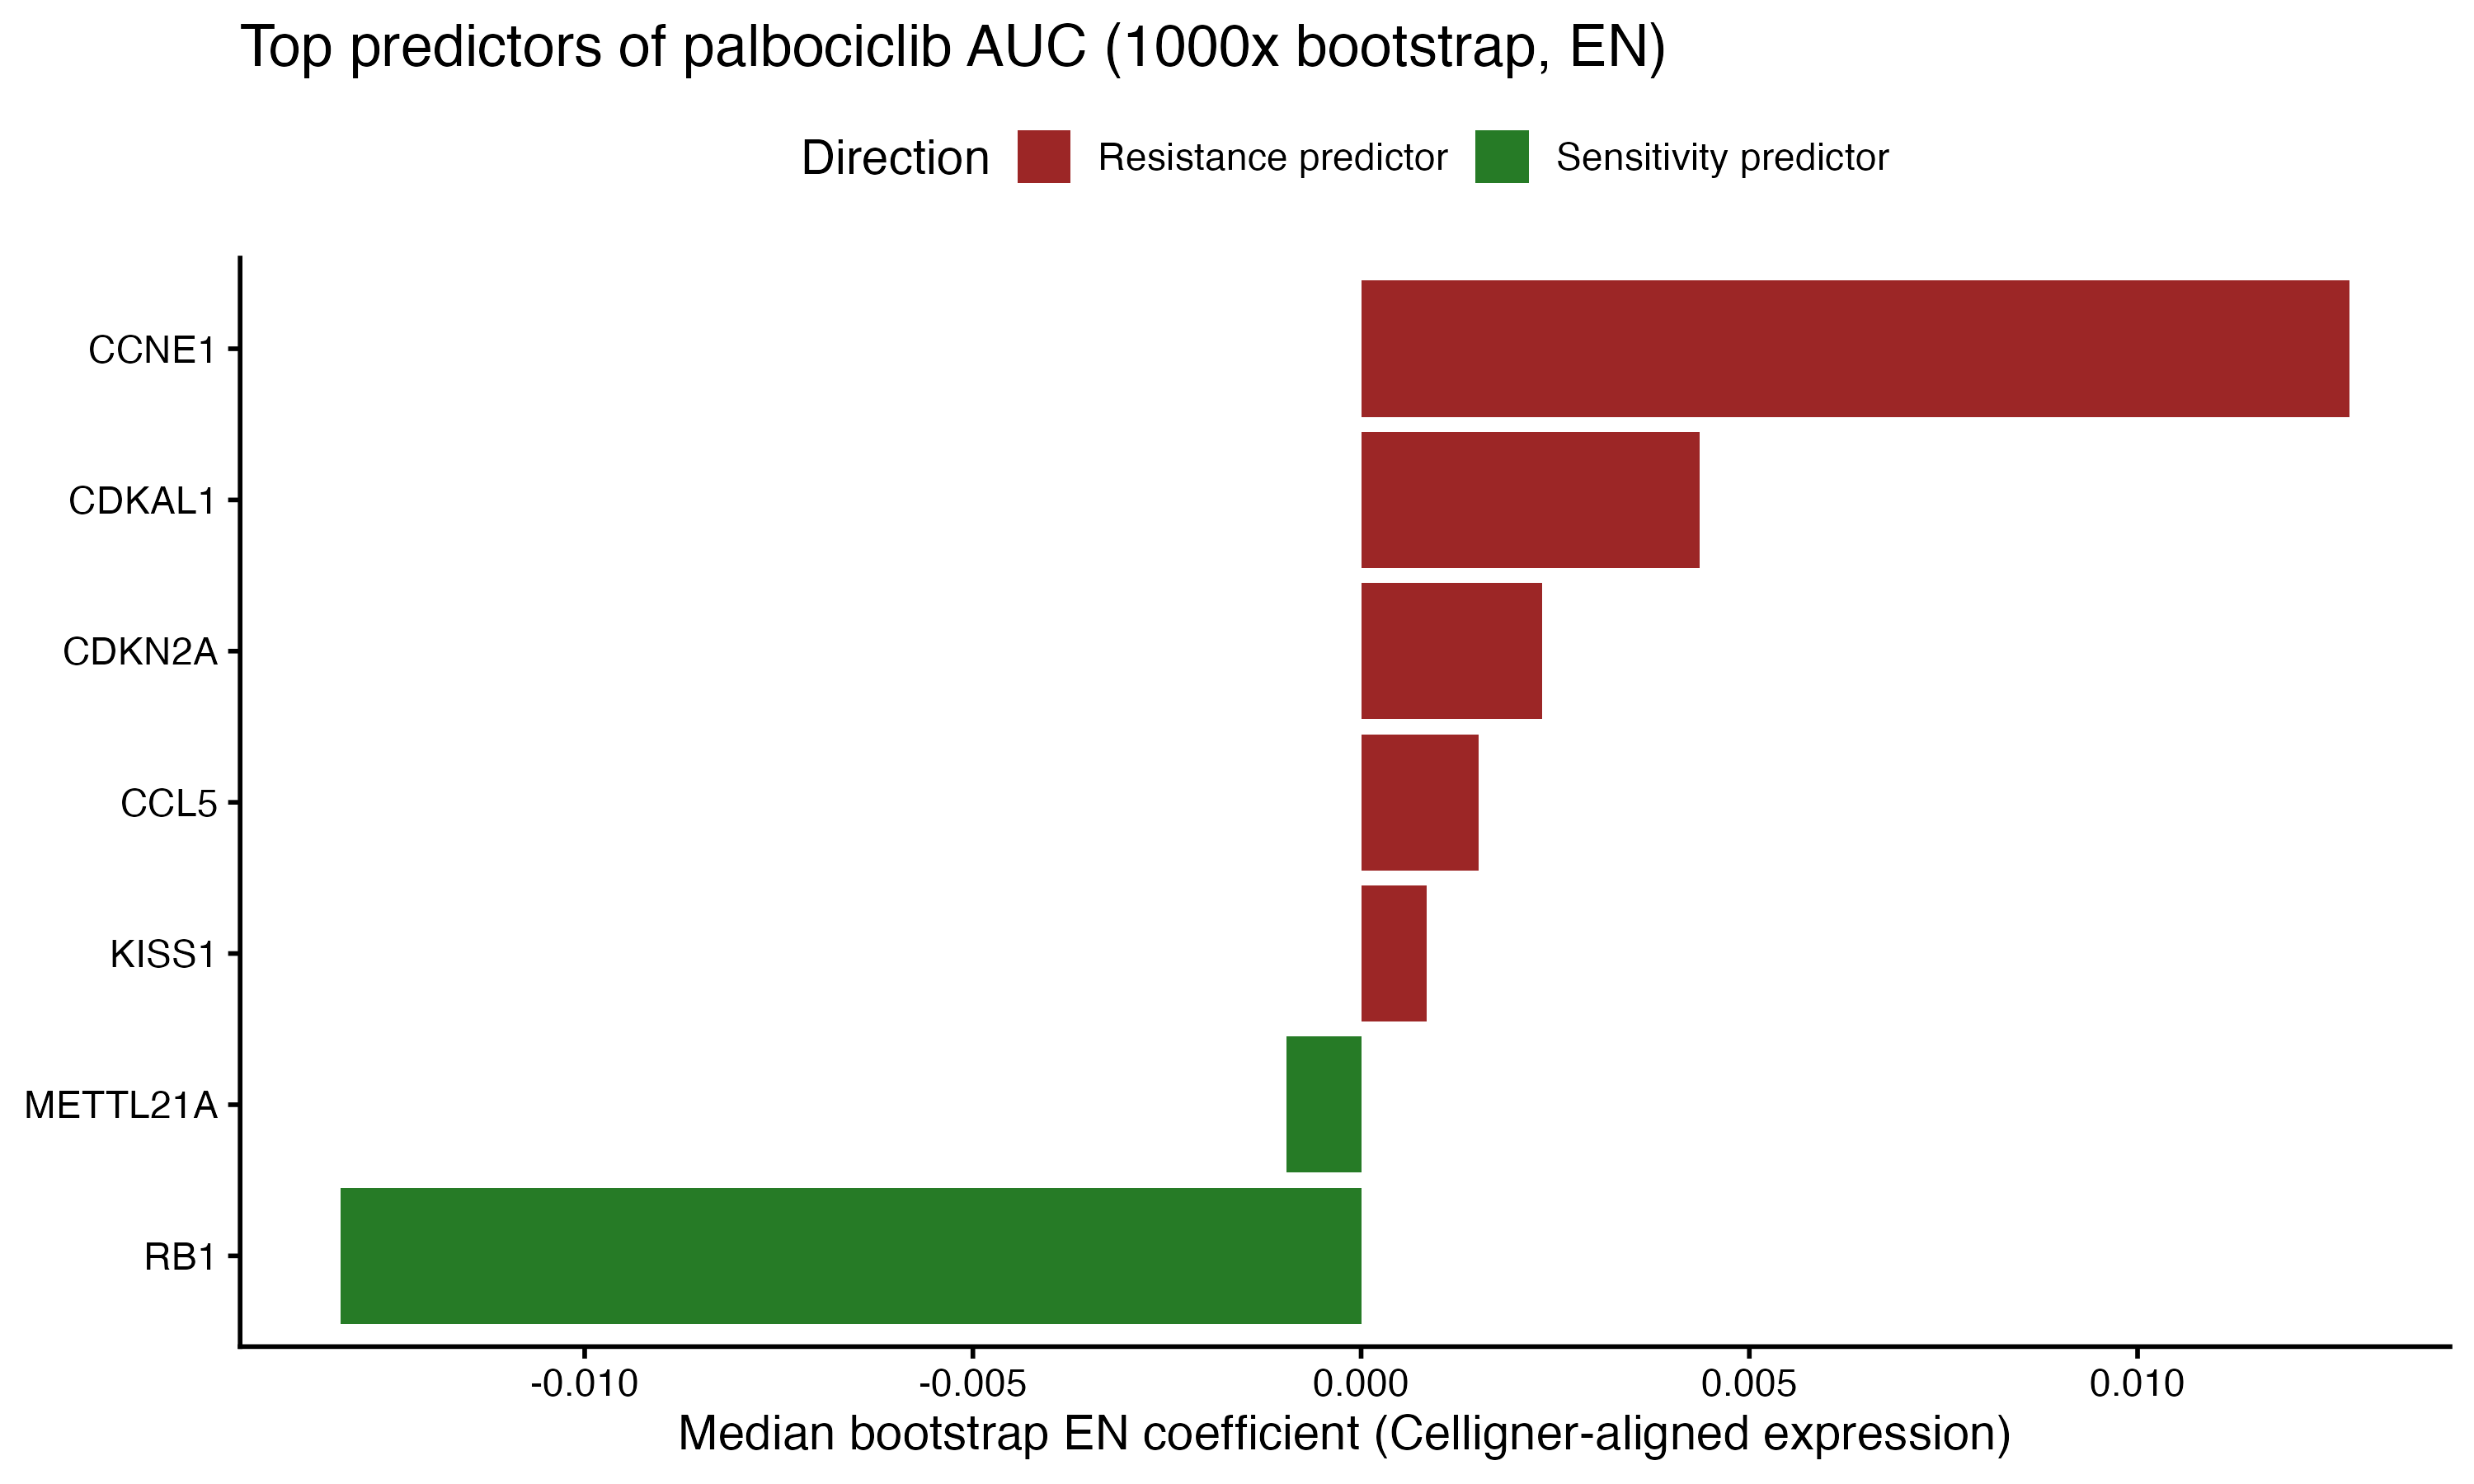
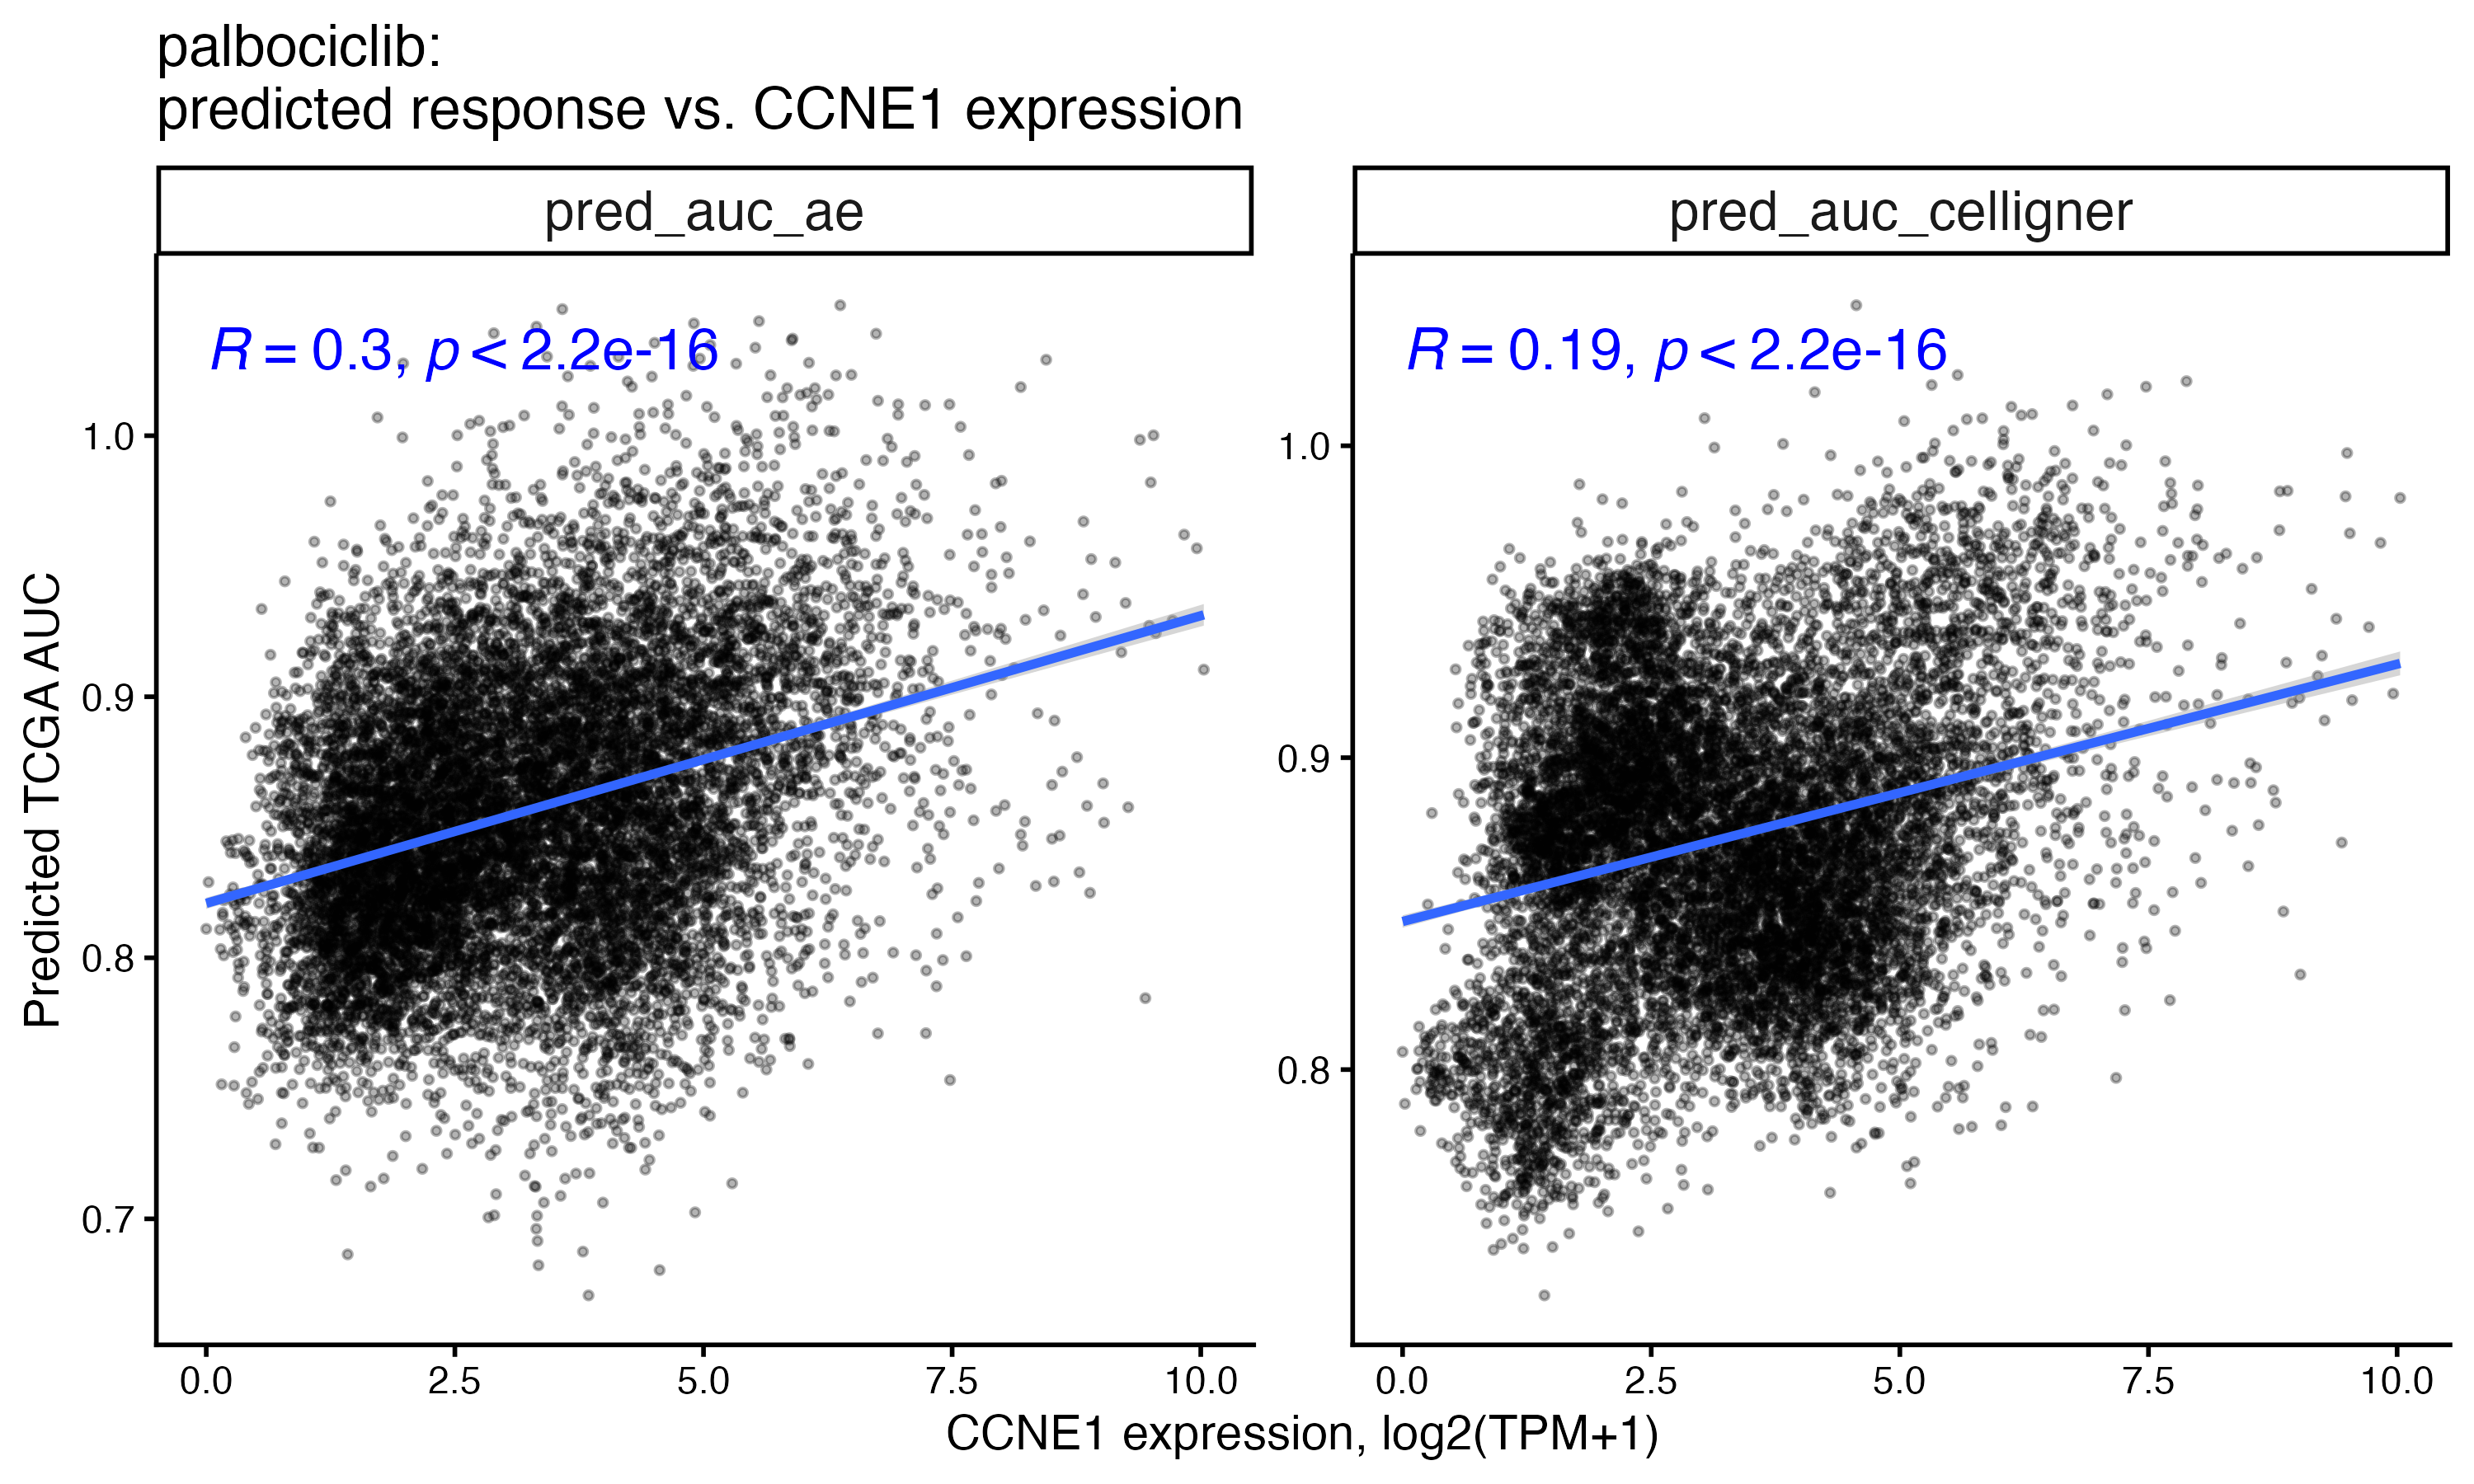
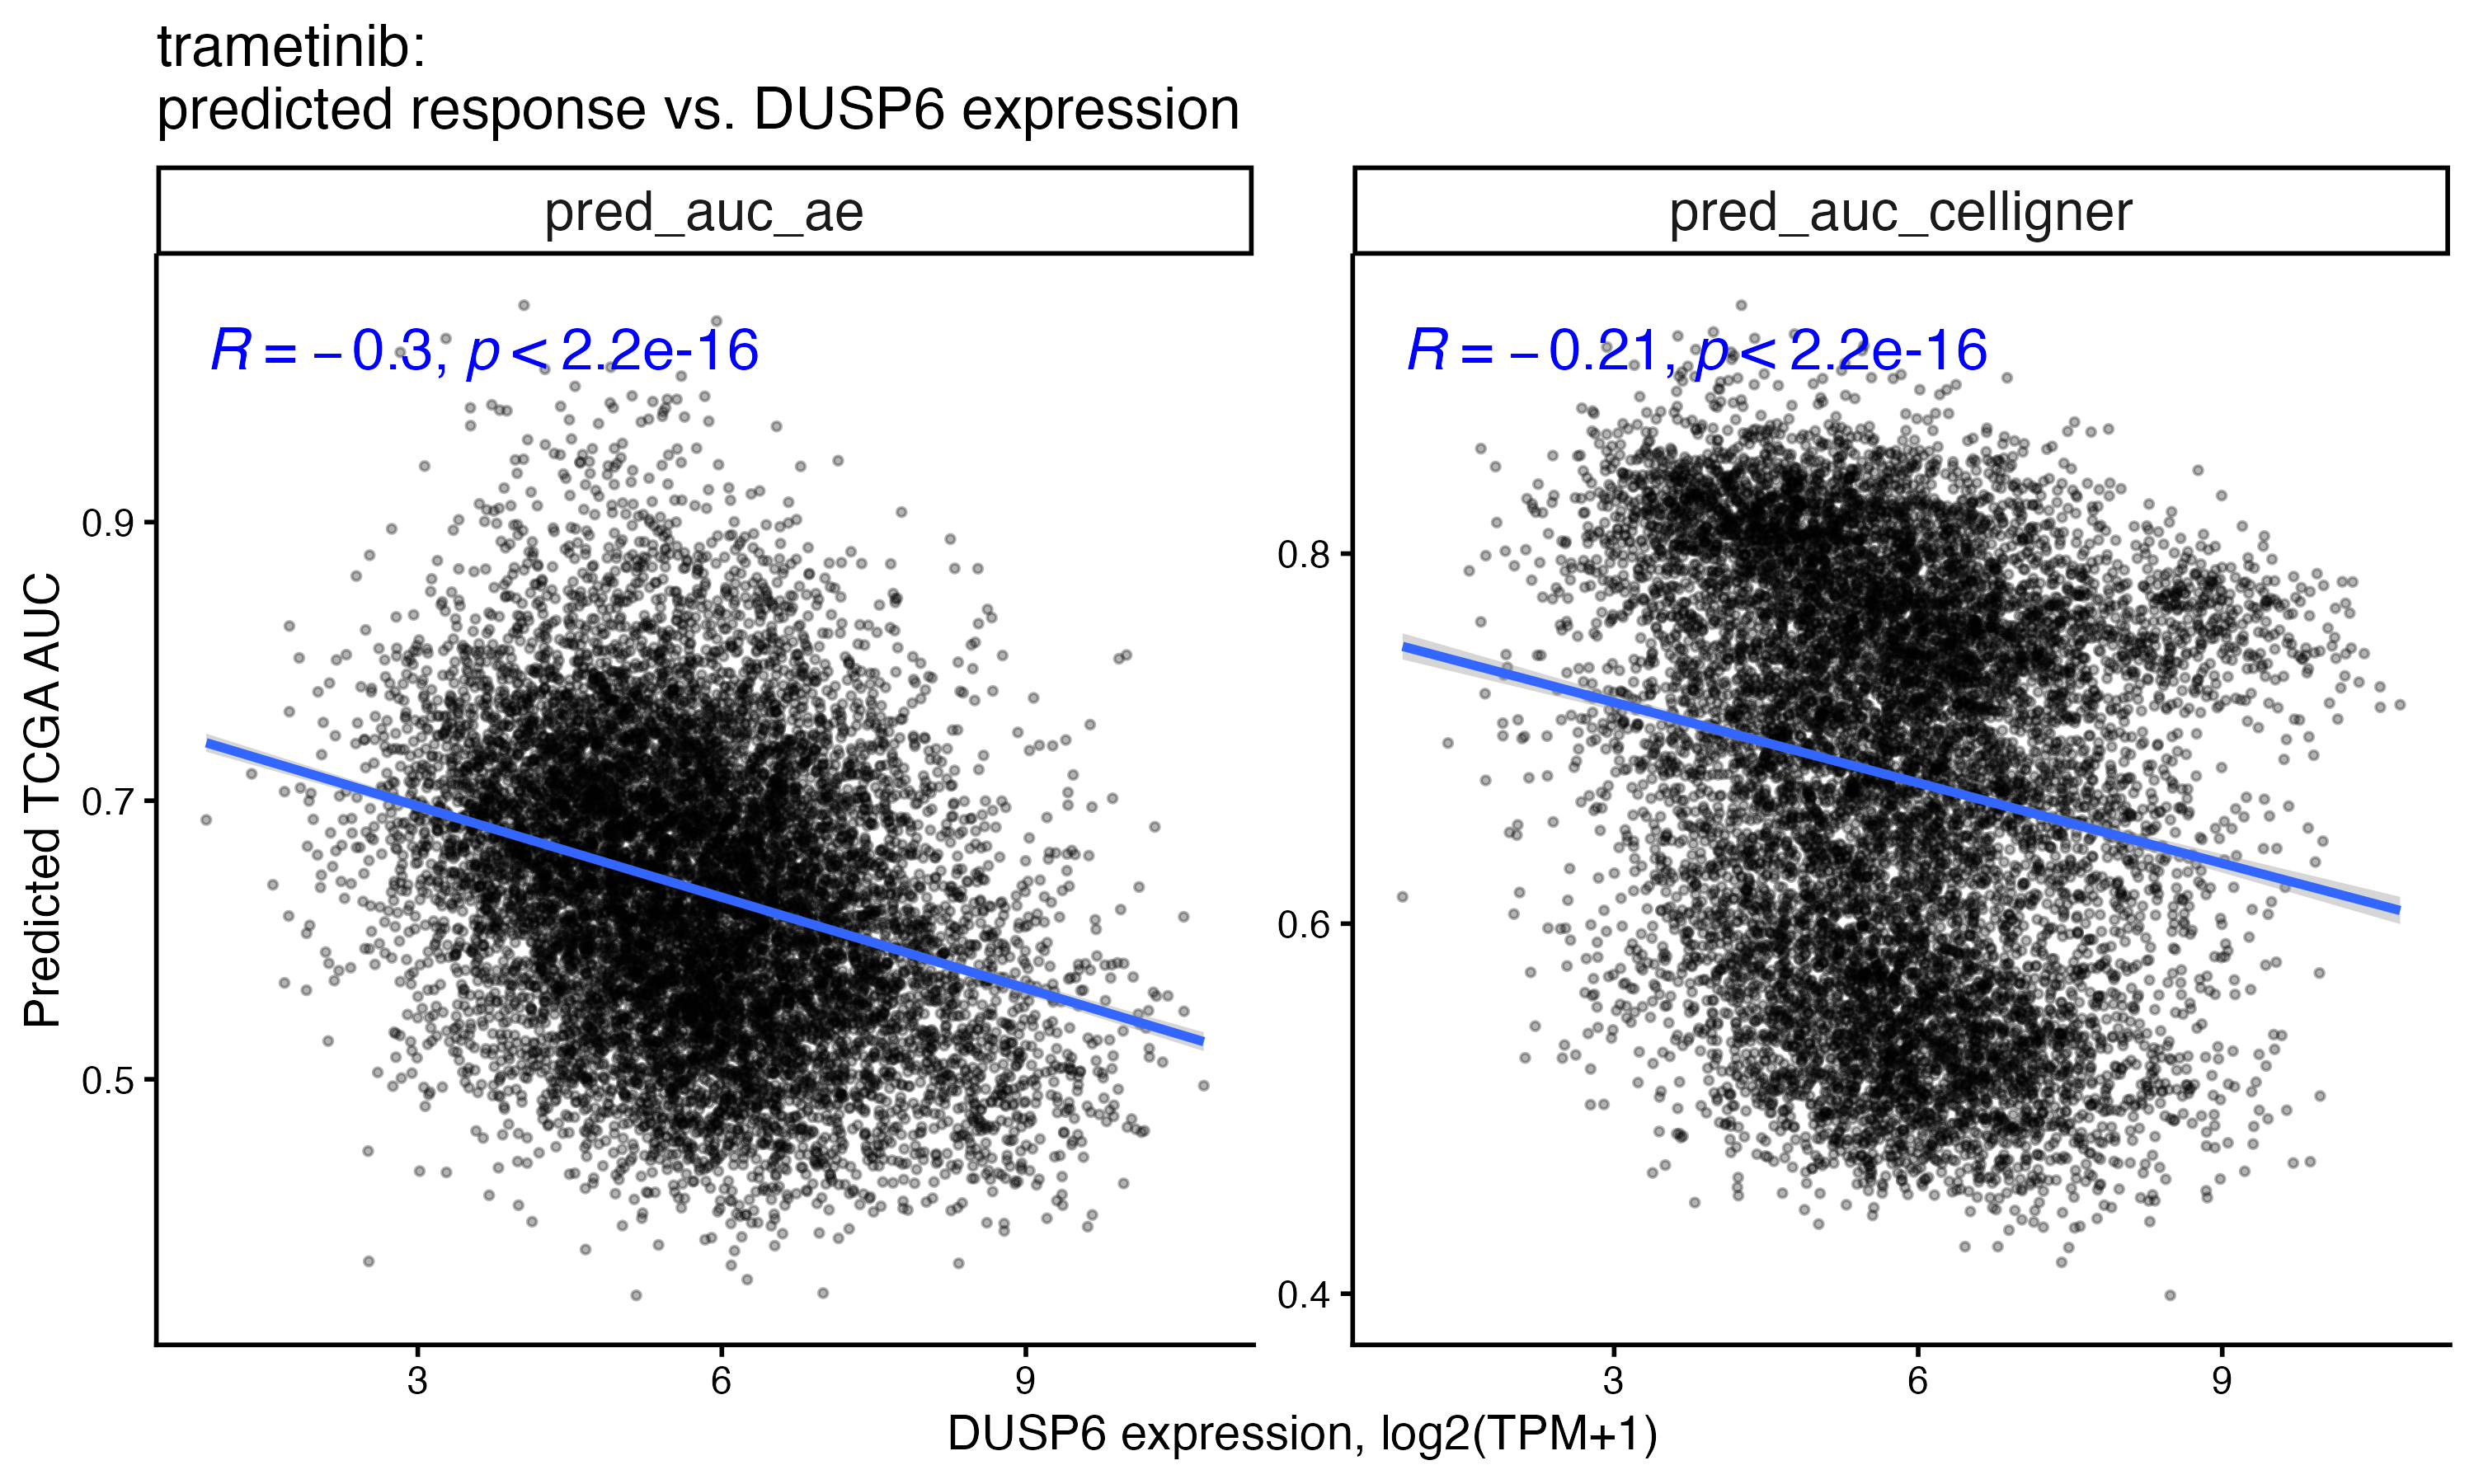
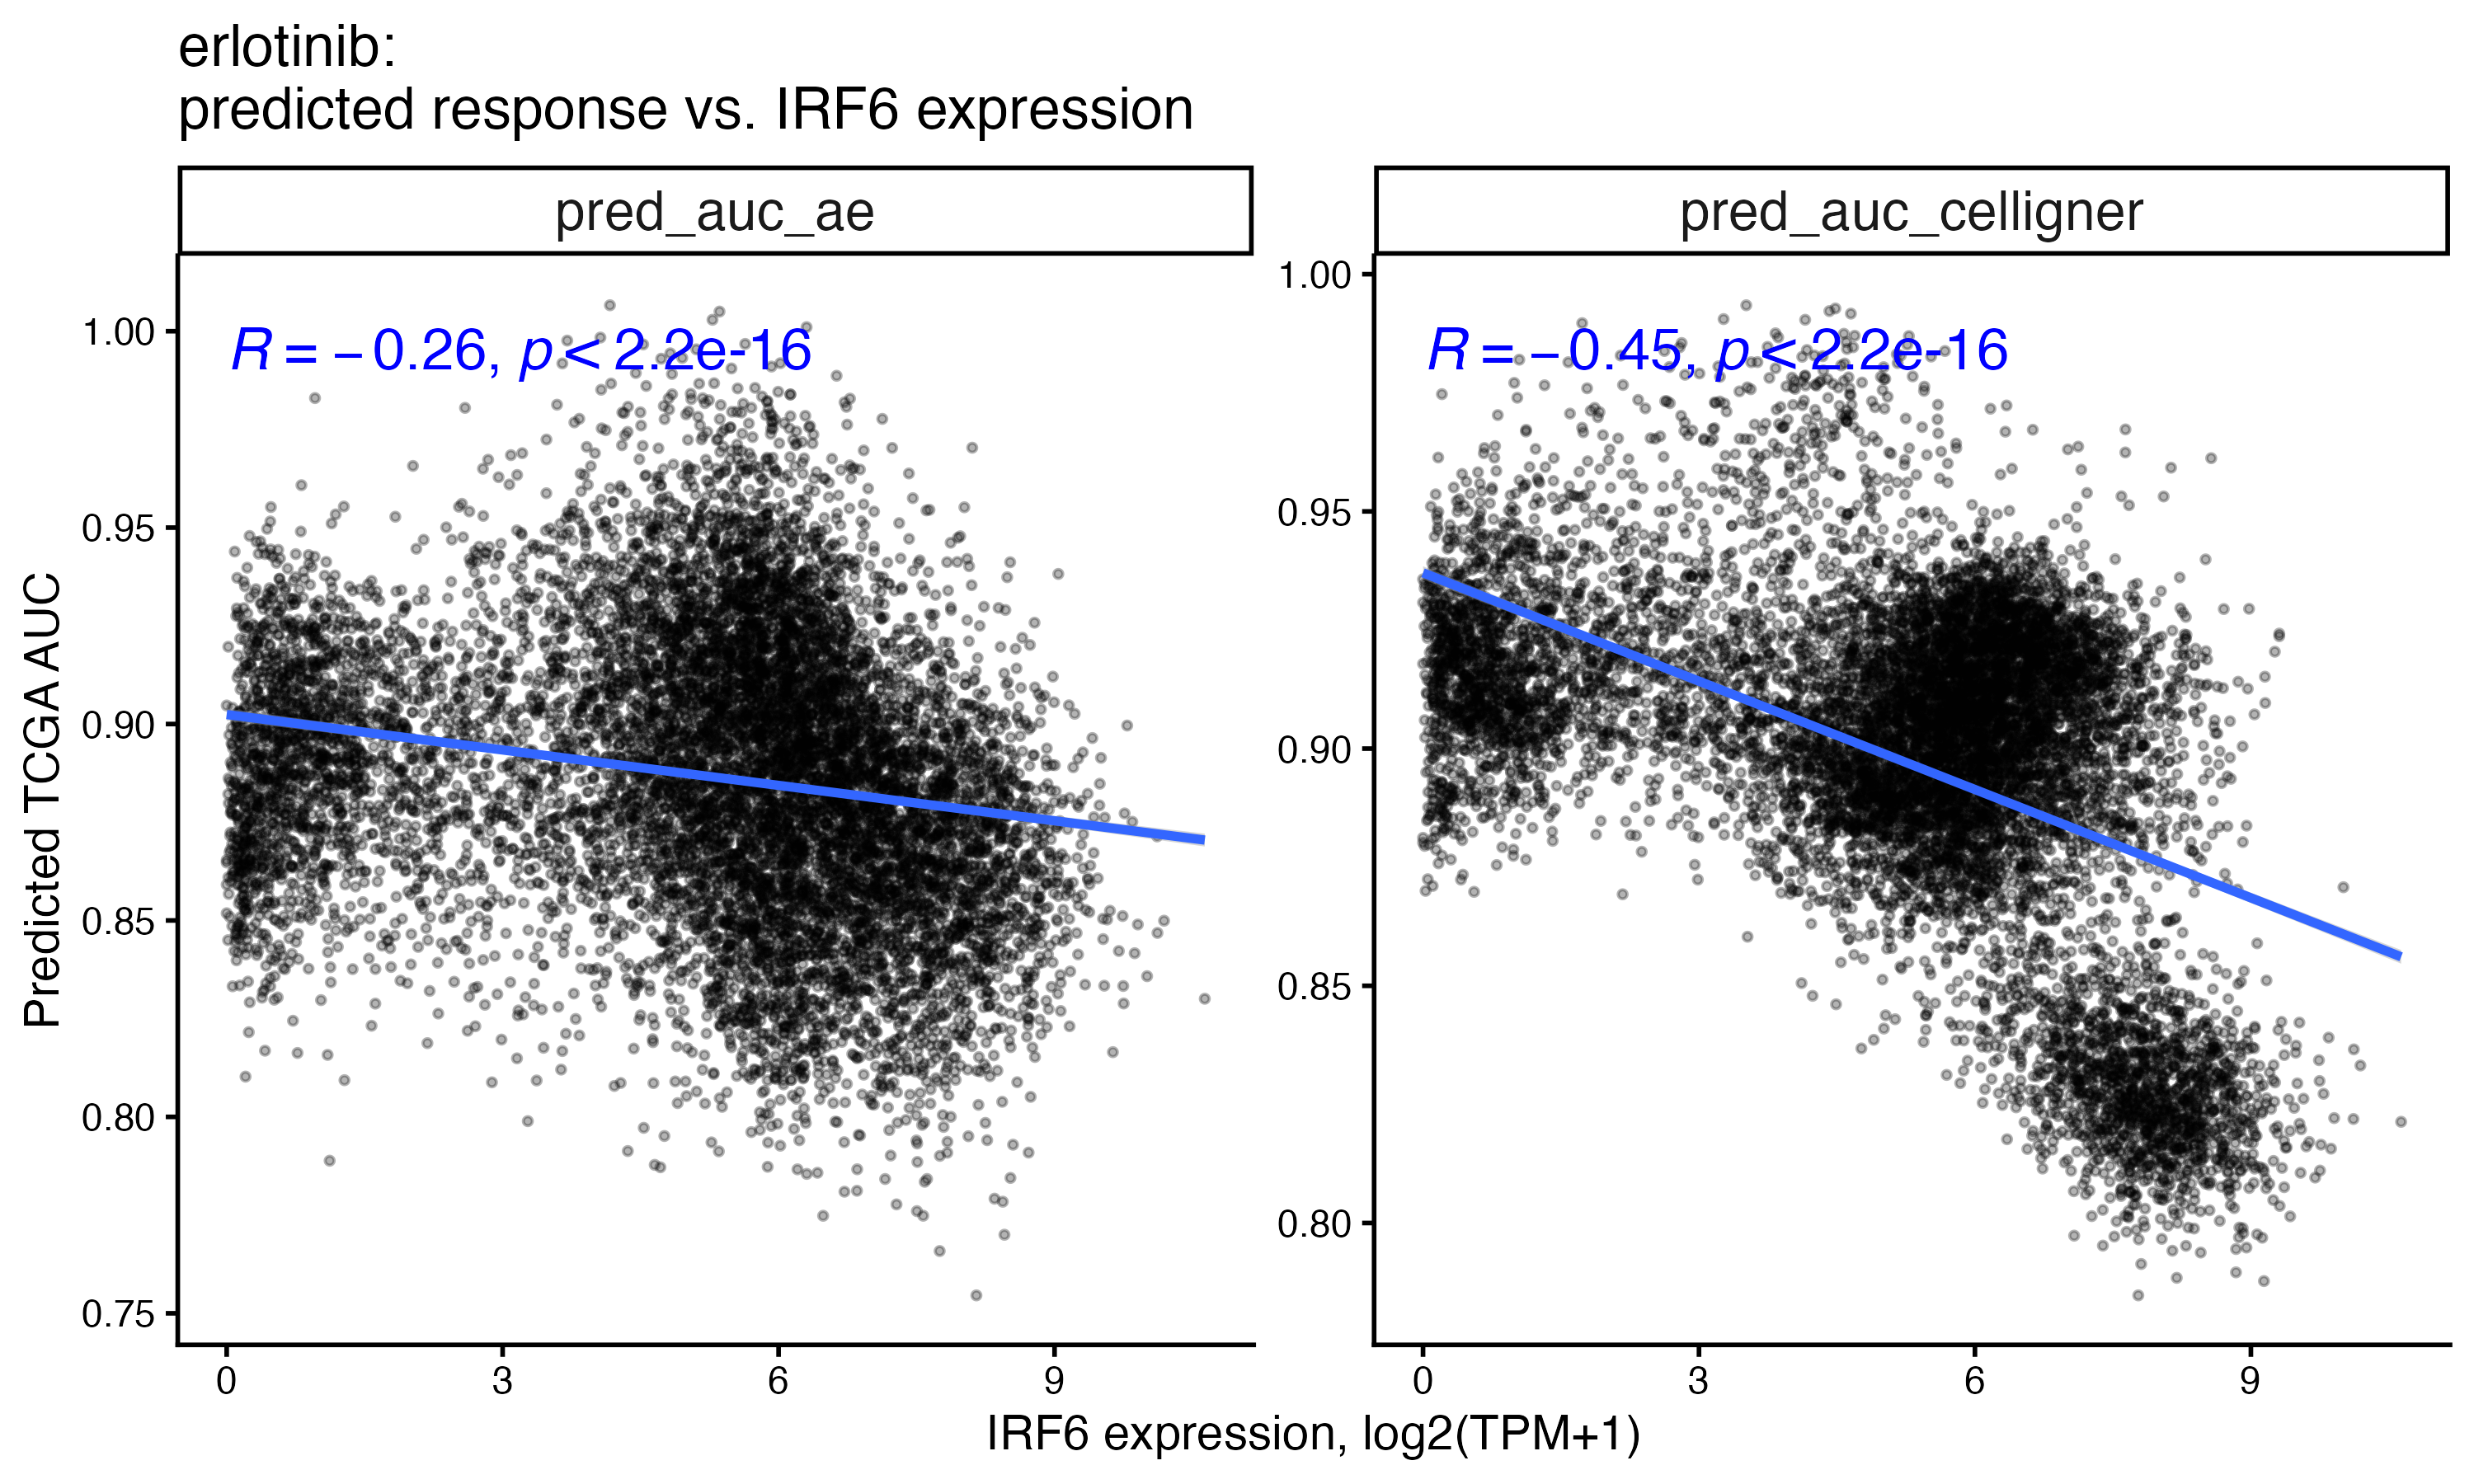
- Can a cell line panel screen predict tumor drug responses and infer tumor sensitivity biomarkers? I applied the EN models trained on the cell line panel to predict drug responses for more than 11,000 TCGA tumors across multiple indications. In the cell lines, the EN model recovered RB1, CCNE1 and CDKN2A, all established biomarkers of response to the CDK4/6 inhibitor palbociclib. In tumors, the predicted AUC of selected drugs correlates with the expression of genes previously linked to their response, including CCNE1 for palbociclib, DUSP6 for trametinib and IRF6 for erlotinib. Because uncertainty quantification is important for ML predictions, I also estimated uncertainty with bootstrapping (1,000 resamples, for EN coefficients) and split conformal prediction intervals (Lei et al. 2018) calibrated on held-out cell lines.
In summary, this simulation suggests that with an appropriate domain alignment method, cell line sampling strategy and ML model, cell line panel screen data can be translated into hypotheses about tumor drug response biomarkers, which would then need validation in patient data.
Additional Notes
The six selected drugs:
| Drug | Class | Biomarker context |
|---|---|---|
| palbociclib | CDK4/6 inhibitor | cell-cycle biomarkers |
| trametinib | MEK inhibitor | MAPK-pathway biomarkers |
| erlotinib | EGFR inhibitor | EGFR biomarkers |
| olaparib | PARP inhibitor | BRCA1/2 / HR-deficiency biomarkers |
| paclitaxel | tubulin-targeting taxane | broad chemotherapy, no single-gene biomarker (contrast arm) |
| bortezomib | proteasome inhibitor | mechanistically distinct sixth arm |
EN hyperparameter tuning: the alpha parameter in EN sets the mixing ratio between ridge (L2) and lasso (L1) penalties. Because Celligner- and AE-aligned expression have very different dimensions, I treated alpha as a structural, domain-specific hyperparameter and tuned it separately for Celligner and AE data by cross-validation (CV). Once alpha was selected, the lambda parameter was tuned within each drug, sample size and repeat, so that the penalty is optimized for each condition (for example, smaller samples may favor a larger penalty).
Disclosures
The R code used in this simulation was written with the aid of Claude Opus 5.5.
References
Bender, A., Thomas, M. C., Scannell, J. W., Shaywitz, D. A., Ghiandoni, G. M., Greener, J. G., et al. (2026). Artificial intelligence in drug discovery — what it is, where we stand and the path forward. Nature Reviews Drug Discovery. https://doi.org/10.1038/s41573-026-01496-2
Corsello, S. M., Nagari, R. T., Spangler, R. D., Rossen, J., Kocak, M., Bryan, J. G., et al. (2020). Discovering the anticancer potential of non-oncology drugs by systematic viability profiling. Nature Cancer, 1(2), 235–248. https://doi.org/10.1038/s43018-019-0018-6
Friedman, J., Hastie, T., & Tibshirani, R. (2010). Regularization paths for generalized linear models via coordinate descent. Journal of Statistical Software, 33(1), 1–22. https://doi.org/10.18637/jss.v033.i01
Ganin, Y., Ustinova, E., Ajakan, H., Germain, P., Larochelle, H., Laviolette, F., Marchand, M., & Lempitsky, V. (2016). Domain-adversarial training of neural networks. Journal of Machine Learning Research, 17(59), 1–35.
Ghandi, M., Huang, F. W., Jané-Valbuena, J., Kryukov, G. V., Lo, C. C., McDonald, E. R., et al. (2019). Next-generation characterization of the Cancer Cell Line Encyclopedia. Nature, 569(7757), 503–508. https://doi.org/10.1038/s41586-019-1186-3
He, D., Liu, Q., Wu, Y., & Xie, L. (2022). A context-aware deconfounding autoencoder for robust prediction of personalized clinical drug response from cell-line compound screening. Nature Machine Intelligence, 4(10), 879–892. https://doi.org/10.1038/s42256-022-00541-0
Lei, J., G’Sell, M., Rinaldo, A., Tibshirani, R. J., & Wasserman, L. (2018). Distribution-free predictive inference for regression. Journal of the American Statistical Association, 113(523), 1094–1111. https://doi.org/10.1080/01621459.2017.1307116
Warren, A., Chen, Y., Jones, A., Shibue, T., Hahn, W. C., Boehm, J. S., Vazquez, F., Tsherniak, A., & McFarland, J. M. (2021). Global computational alignment of tumor and cell line transcriptional profiles. Nature Communications, 12, 22. https://doi.org/10.1038/s41467-020-20294-x
Weinstein, J. N., Collisson, E. A., Mills, G. B., Shaw, K. R. M., Ozenberger, B. A., Ellrott, K., et al. (2013). The Cancer Genome Atlas Pan-Cancer analysis project. Nature Genetics, 45(10), 1113–1120. https://doi.org/10.1038/ng.2764